No items found.
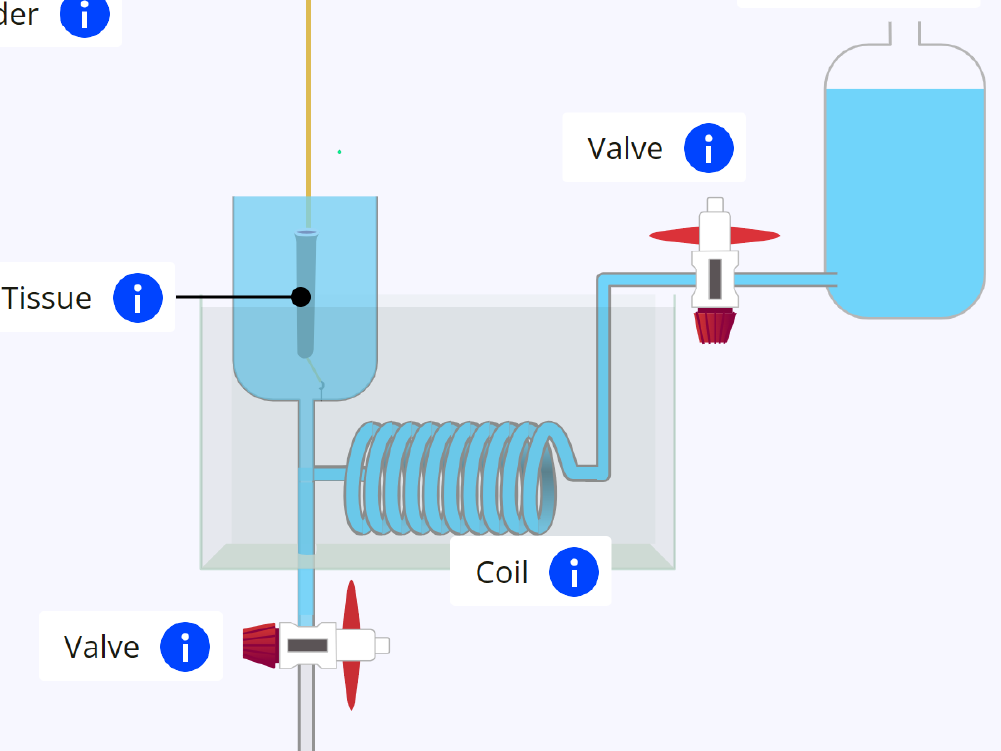
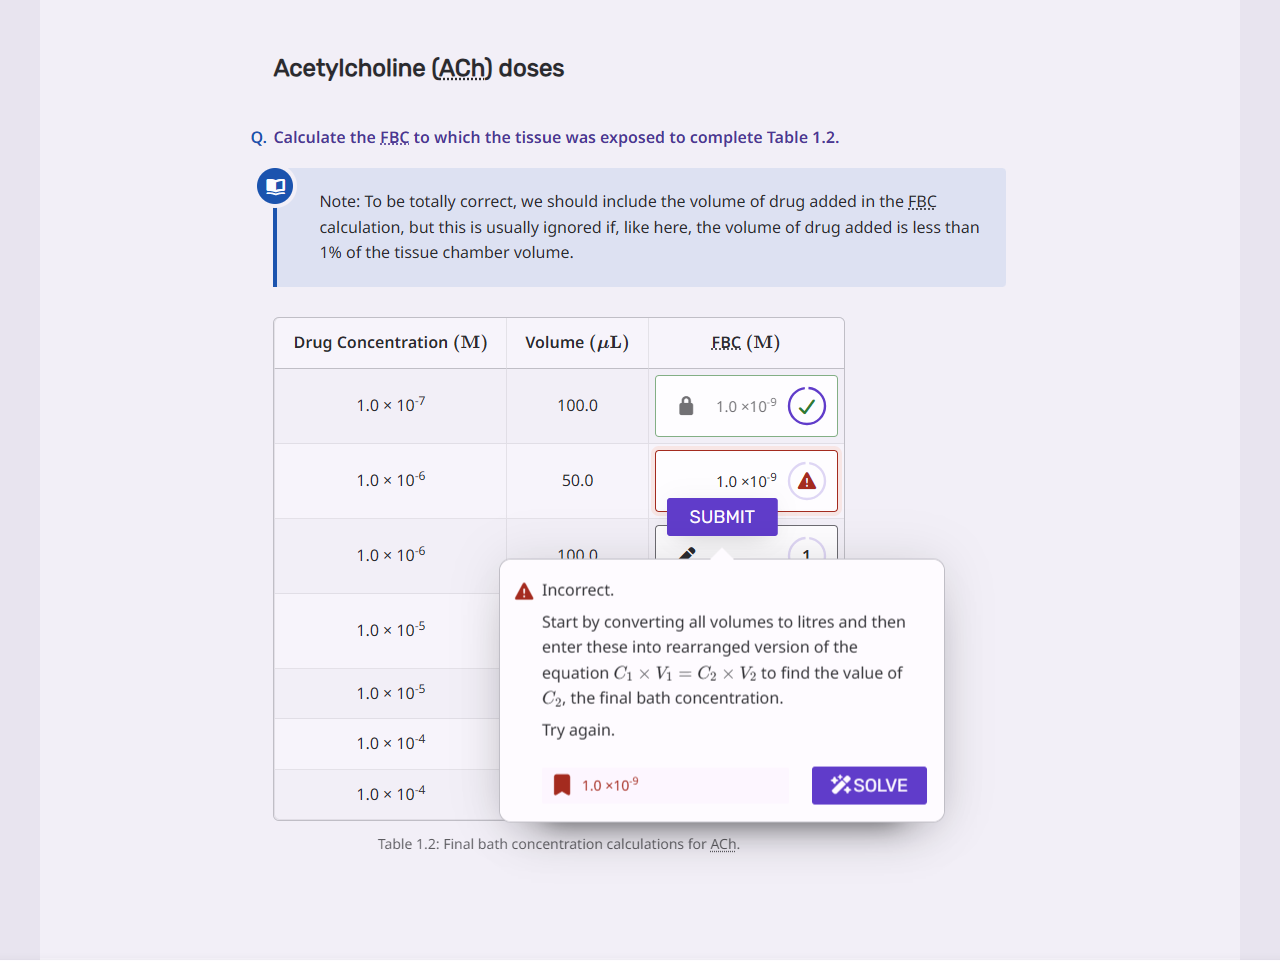
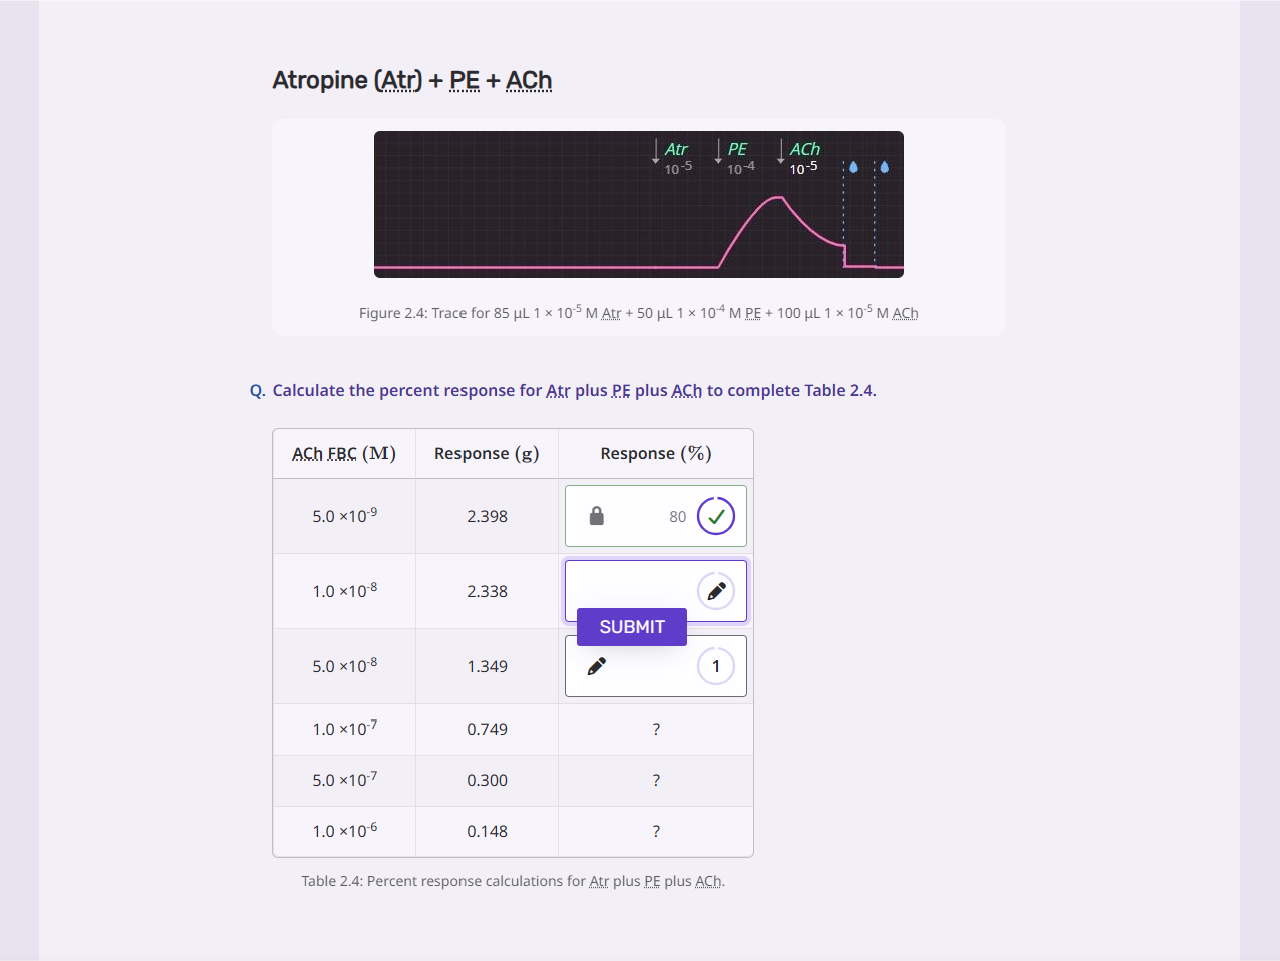
Explore an organ bath experiment on aorta tissue. Calculate a range of drug doses and combinations, determine percentage response from experimental data, and select options such as linear or log scale for plotting the dose-response curves.


.jpeg)
.png)
.png)