< Back to the full list

Spectrophotometry

Assessing and quantifying experimental accuracy and precision: UV-Vis spectrophotometry
No items found.

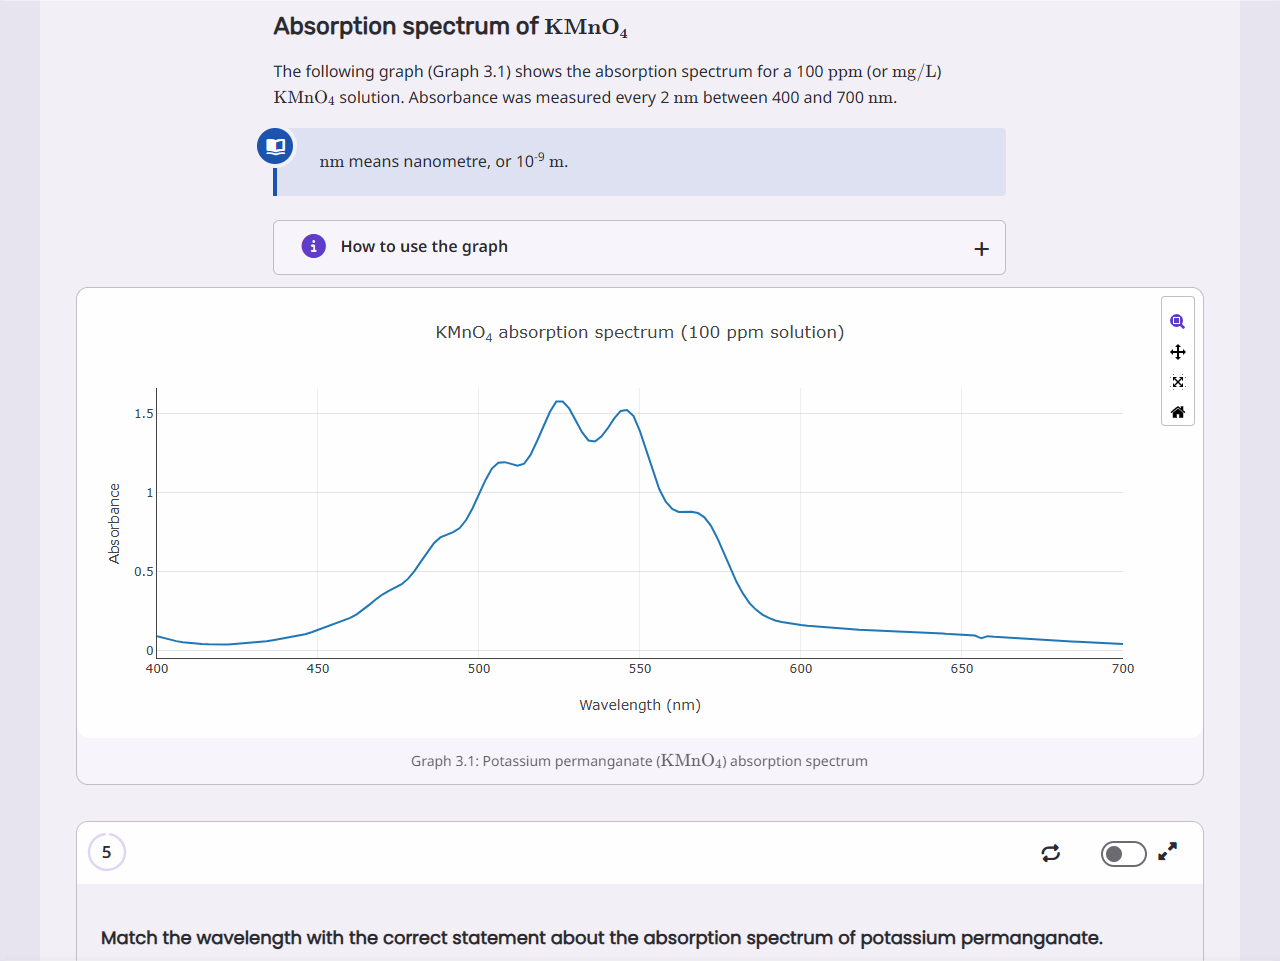
Identify the instrumental components and operational steps required to record a UV-Vis spectrum. Rearrange single-step dilution equations to calculate solution concentrations and required stock volumes. Construct linear calibration curves for potassium permanganate, evaluate calibration linearity using R^2 values, and assess data quality by calculating the accuracy and precision (%RSD) of quality control (QC) samples.

Learning outcomes

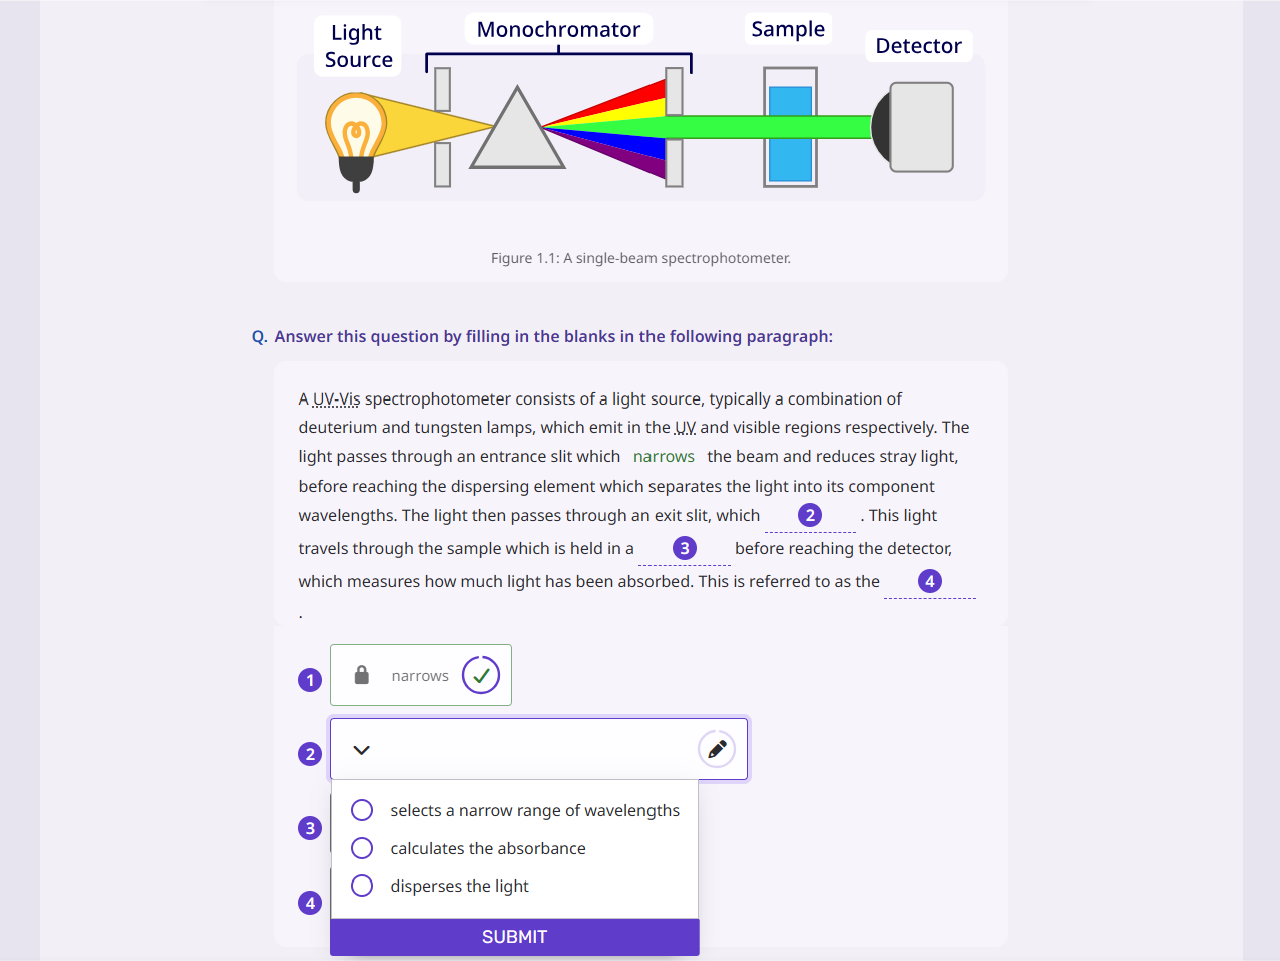
  • identify the steps involved in recording a UV-Vis spectrum.
  • construct a calibration curve to calculate the concentrations of unknown solutions.
  • rearrange equations to perform calculations involving volumes and concentrations.
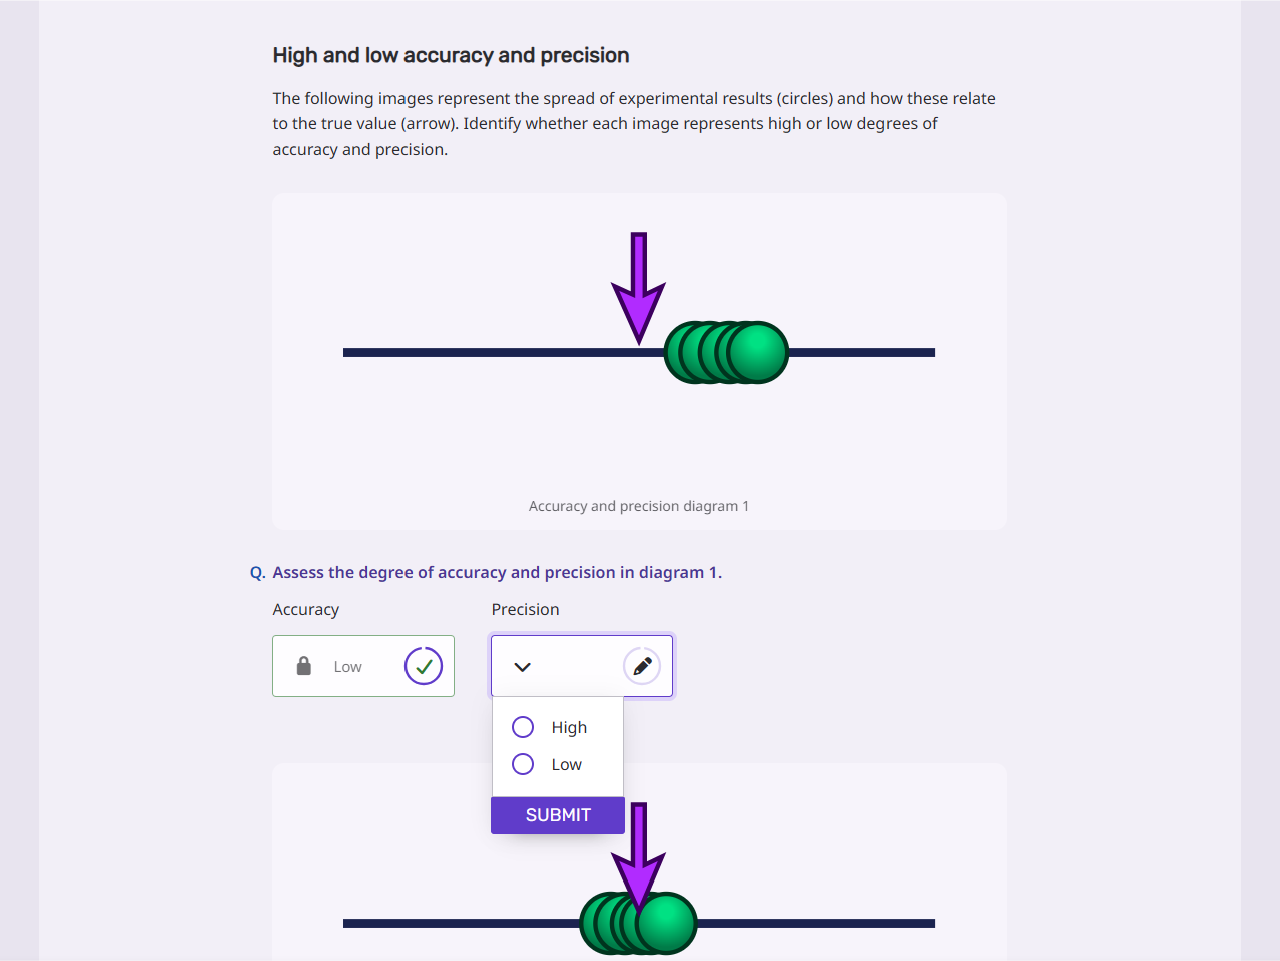
  • distinguish between data linearity, accuracy and precision.
  • assess the quality of experimental data in terms of calibration linearity and QC accuracy and precision.
No items found.
chevron_left
chevron_right

Skills

Using Instruments and Equipment

  • Describe the function of optical components within single- and double-beam UV-Vis spectrophotometers
  • Perform blank calibrations and practice proper cuvette handling to record accurate absorbance measurements

Manipulating and Presenting Data

  • Rearrange the single-step dilution equation C_1V_1 = C_2V_2 to calculate required stock volumes and final concentrations
  • Plot absorbance versus concentration calibration curves and compute standard deviations and %RSD values from raw dataset trials

Interpreting and Analysing Data

  • Evaluate calibration curve linearity and R^2 values to detect data outliers
  • Compare experimental QC concentrations against true values and evaluate relative standard deviation (%RSD) to assess accuracy and precision

Concepts, Principles and Theories

  • Explain the operational principles of UV-Vis spectrophotometry and distinguish between data linearity, accuracy, and precision
  • Apply the linear relationship between light absorbance and solute concentration to evaluate theoretical experimental quality

Learn more about our approach to skills
Dr Yin Sim Tor
Taylor’s University

“Smart Worksheets gave us meaningful insight into how students think through bioscience problems, moving beyond simply tracking them completing a task.”

Details

Degrees

Foundation science
Chemistry

Discipline

Solutions and dilutions

Topic

Spectrophotometry

Purchase option

The Smart Worksheet Library

Related products

What are LabSims?

Our virtual lab simulations enhance student learning by building confidence in practical skills.
  • Enhance student skills and accelerate learning with multiple opportunities to practise
  • Boost confidence and competency with enhanced support and personalised feedback
  • Engage and motivate with enjoyable, challenging learning experiences
LabSim product page

What are Smart Worksheets?

Online, autograded assessment tool for advanced data analysis and calculation practice
  • Improve the student experience of assessment with immediate, targeted feedback
  • Save academic time by minimising repetitive marking for staff
  • Gain immediate insight into student progress with individual performance data
Smart Worksheets product page

Integrate with your LMS

Our products integrate with all major learning platforms, including Canvas, Blackboard, Moodle, Sakai and Brightspace or without any LMS using our LearnSci Direct Platform.
Learn more about LearnSci Direct.
No items found.

See how our resources can enhance your student experiences

  • Try our resources for free
  • Get a live demonstration of our products
  • Become a partner and join our community
  • Talk to our team of experts
Request a demo
Image of a smiling student with a microscope