No items found.
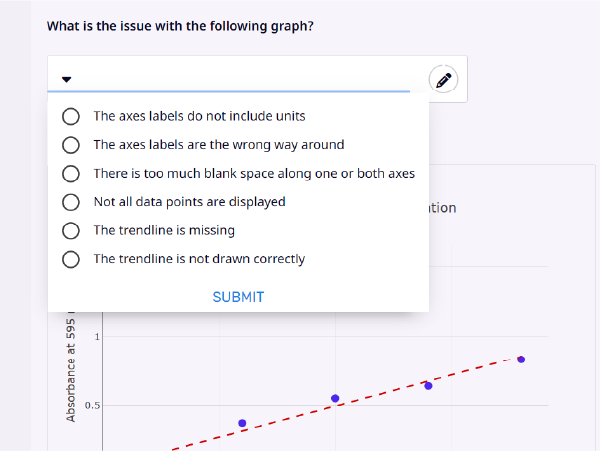
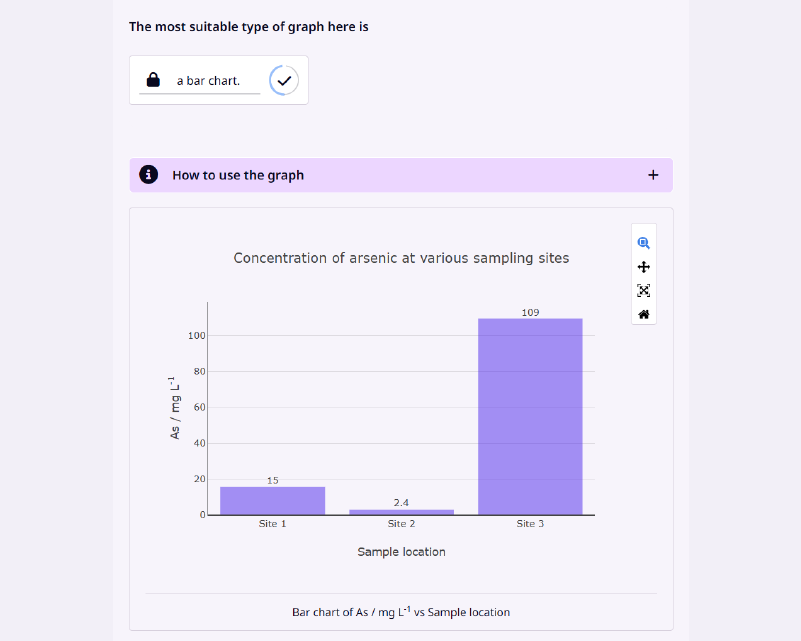
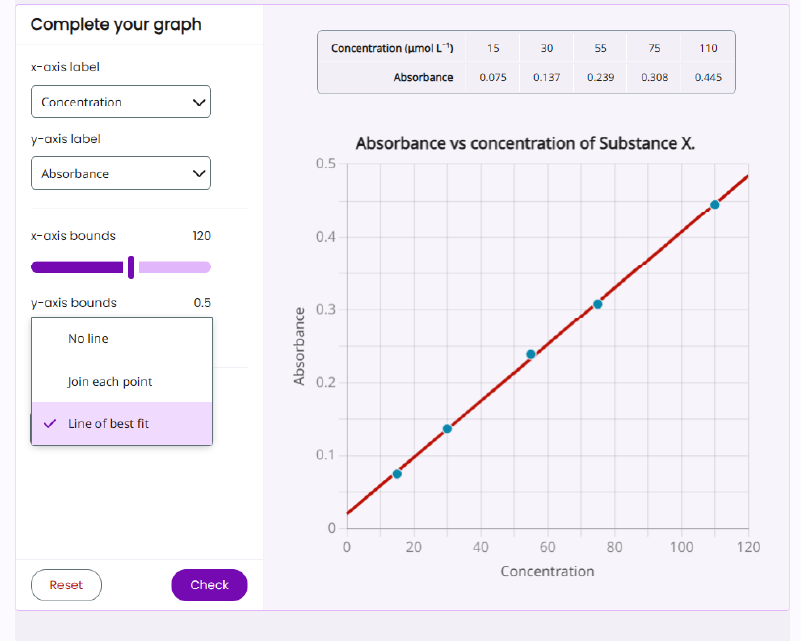
Develop skills in data visualisation and graphing for forensic science applications. Select appropriate graph types, creat well-presented scatter plots, interpret trendlines and apply these skills in a realistic lab scenario.
Develop skills in data visualisation and graphing for forensic science applications. Select appropriate graph types, creat well-presented scatter plots, interpret trendlines and apply these skills in a realistic lab scenario.


“Students welcome the opportunity to repeat calculations with different data to test their understanding of the material. Student feedback on courses that I teach that use Smart Worksheets, always highlight this as a very positive aspect.”