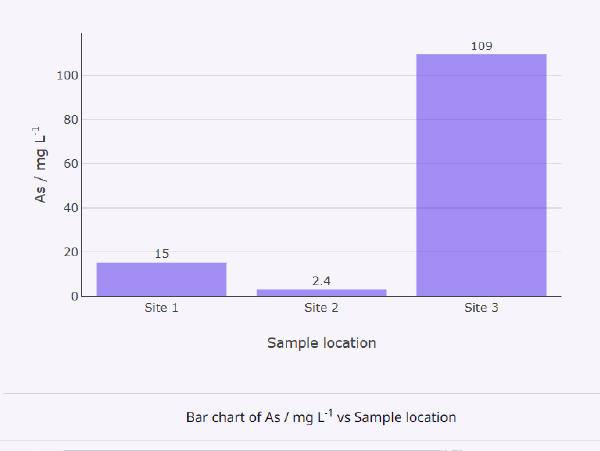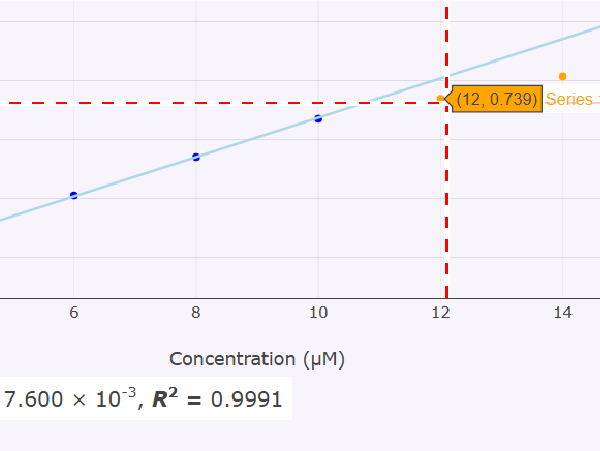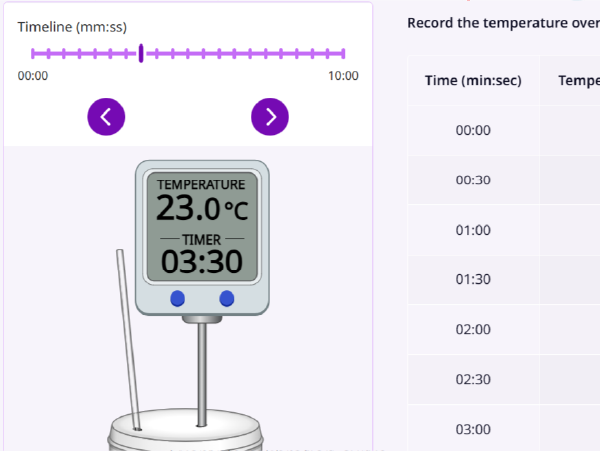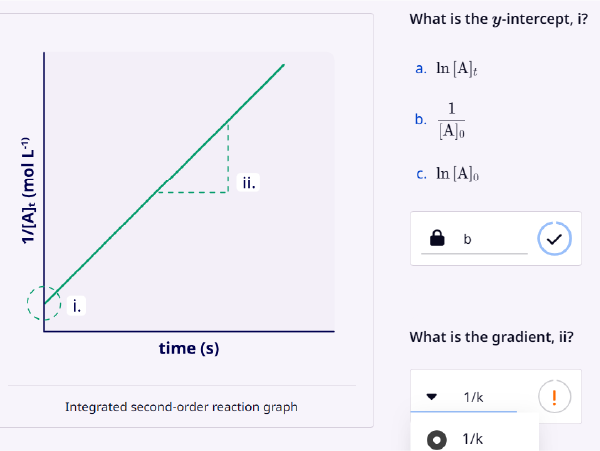
No items found.
Develop skills in data visualisation and graphing for pharmacy applications. Select appropriate graph types, creat well-presented scatter plots, interpret trendlines and apply these skills in a realistic lab scenario.
Develop skills in data visualisation and graphing for pharmacy applications. Select appropriate graph types, creat well-presented scatter plots, interpret trendlines and apply these skills in a realistic lab scenario.


"I found using Smart Worksheets easy and clear. The lecturers helped us to understand how to work with them. They gave us a lot of examples and questions, so we practised a lot through our course. When the exam took place, we all were confident enough to pass this part of the exam."